
REPORTING
What is a Reporting?
Reporting primarily refers to the means and measures for collecting, processing, storing, and presenting information within an organization. Reporting also aims to simplify complexity and make data more accessible to specific target audiences and stakeholders, both internally and externally. To achieve this, information related to the company and its environment is prepared in the form of reports. The types of reports can be diverse, but tables and charts are often used for presentation. It’s essential that data is made available to users in an understandable and organized manner.
When it comes to reporting, the terms Controlling and Monitoring are often used in this context. However, the distinction is not always clear. This is because all three terms are frequently used interchangeably. Nevertheless, there are fundamental differences: Monitoring primarily involves the surveillance of various processes and can trigger an alarm as a result. Reporting aims to provide information. Monitoring and reporting occur in parallel and describe two different processes. Controlling, on the other hand, describes management within the organization and relies on existing data. Reporting serves as the basis for Controlling and is associated with this area in that regard.
Why is Reporting Important?
For Controlling and thus for business management, it is essential that corporate data is well-prepared and readily available. There are several reasons for this. Firstly, reporting serves as a knowledge transfer within the company. Employees from different departments or in leadership positions, as well as top management, can quickly gain an understanding of business processes with which they are less familiar, as the data has been collected and prepared professionally in reports. Therefore, reports reduce information losses within an organization.
Secondly, reporting is generally a valuable tool for analysis within a company. It provides the basis for effective and efficient evaluations, on which the management and development of strategies are based. Thus, reports directly support operational and strategic business management, and decisions do not have to be made “on a gut feeling.” For example, reporting can provide insights into whether the marketing mix, with specific activities such as social media plans, website activities, or the latest campaigns, contributes to achieving goals and to what extent.
This is achieved because reports allow conclusions to be drawn about the content published and the associated user behavior, as well as the overall activities of the company over an extended period. This makes the sometimes challenging-to-measure actions quantifiable and qualifiable. In simpler terms, questions like “Is what I’m doing making sense at all?” and “How successful am I with it?” can be answered in a well-founded manner.
What Should Reporting Include?
Reporting can vary in appearance from one company to another, depending on its purpose. Standard types of reports include marketing reporting, financial reporting, sales reporting, management reporting, human resources reporting, procurement reporting, or IT reporting. These reports typically include areas such as balance sheets, income statements, and other key metrics, such as those from social media marketing. This results in a multitude of different ways to present these reports. To ensure that a report is highly informative and beneficial to other stakeholders, it must meet certain criteria.
The reporting…
1. … should be tailored to the audience that works with it. All information must be factually correct and understood by everyone. In addition, the reporting must be written from an objective perspective.
2. … must be consistent. This means that the same terminology should always be used, and the structure should not change.
3. … should be designed for one or more specific objectives. Clear control information for the recipient can only be generated with the background of goal formulation.
4. … must be quick and easy to create. Once the basic structure is in place, daily, weekly, or monthly evaluations should not take up much time.
5. … should only contain the key performance indicators (KPIs) required for the objectives. The focus here is to concentrate on the essential and not to include all available metrics.
Best Practice: Reporting & Analysis in the “Social Media” Area
To illustrate, here’s an exemplary report of a fictitious existing user account, using Instagram as the basis. The abbreviation “KW” represents the individual calendar week of the year. In this example, a report is created for the first time in KW 1, which is why there are no metrics regarding the increase/loss compared to the previous week (see “Growth in the Last 7 Days”).
The purpose is to demonstrate what a tabular form of reporting might look like. However, please note that this report is a highly simplified and reduced version, focusing on the typical Social Media Key Performance Indicators (KPIs) such as Impressions, Reached Accounts, Profile Views, Followers, and Engagement.
As an additional analysis and assistance for later examination, the percentage changes in KPIs compared to the previous week have already been calculated. This allows for making initial qualified statements.
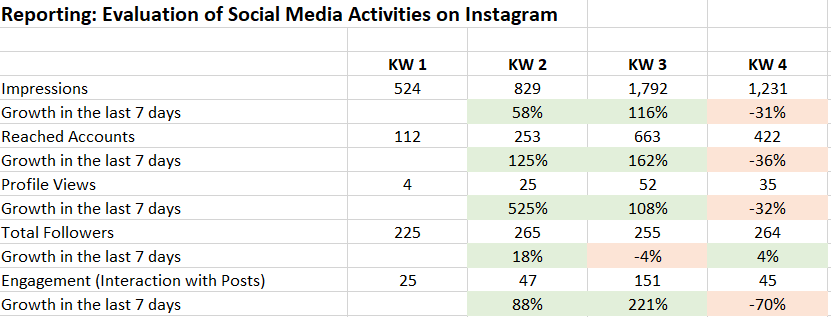
Using this table, you can clearly see the changes in the metrics over a four-week period. Almost all areas have consistently increased. This provides an initial indicator that the marketing efforts employed are effective. However, the ultimate success depends on multiple factors and KPIs and is measured based on the degree of goal achievement. In this example, if the goal was to increase reach (Impressions + Reached Accounts) over the total four-week duration, then this goal was achieved.
Identifying Events Quickly
However, it’s also noticeable that the number of followers in week 3 has significantly decreased compared to the previous week, even though impressions, reached accounts, profile views, and especially the engagement rate have increased. In this case, it’s appropriate to take a look at the content that was published. Perhaps a post didn’t resonate with users, or there may have been a significant negative reaction. Such events inevitably impact the metrics and become evident in the reporting.
Looking at the reporting table and the color-coded fields, it’s also evident that extremes, both positive and negative, often become apparent with a delay. The effects from week 3, for example, are only clearly visible in the table in week 4. Ideally, significant events, such as a potential social media crisis, should not be noticed for the first time in the reporting.
Interpreting Metrics Correctly
Declines in metrics can have other causes aside from the content itself, both in social media and other areas. For KPIs related to Google, for example, website performance usually plays a crucial role. If Google launches a new update and alters its algorithm, it could result in your website no longer being indexed. This can also manifest as poor numbers in the reporting or the reporting tool/system being used.
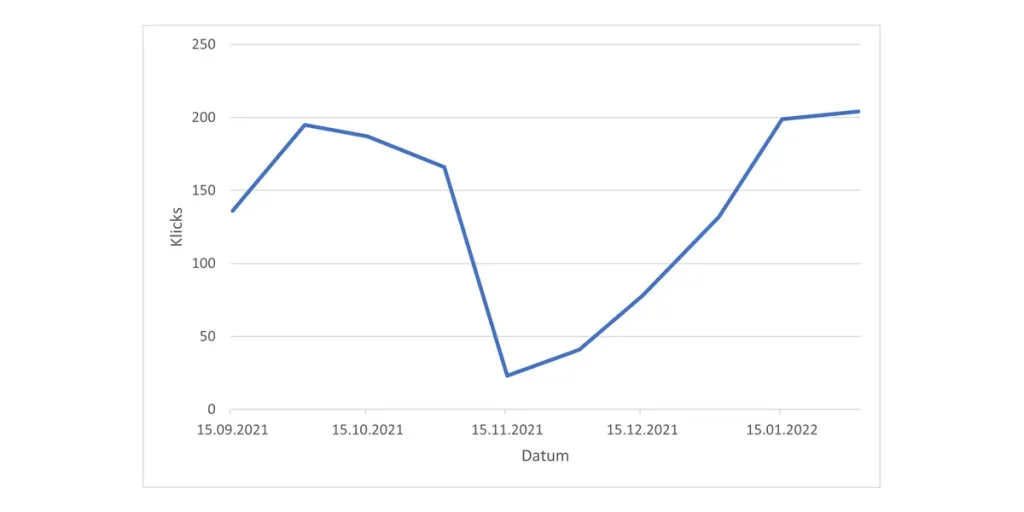
In mid-November, Google launched a core update. In this example, the click numbers on the website plummeted significantly.
Reporting with SharePoint and Microsoft 365
There’s no doubt that reporting is a crucial component in any business. However, manually creating reports can be not only tedious but also time-consuming. Particularly in large enterprises dealing with a significant volume of data (often referred to as “Big Data”), it’s advisable to manage this data within systems.
These so-called “reporting systems” are often embedded in Document Management Systems (DMS) or Enterprise Resource Planning (ERP) systems. This means that the data source from which the reporting system can draw its information is located there.
Visualizing Data with Reporting Systems
Reporting systems have the task of automatically and visually presenting the data collected in the organization. This can include tables, as seen in our social media example, as well as charts and dashboards. These visualized data provide more transparency, free up human resources, and create a fact-based overview of the current business processes in the respective business areas. Additionally, this approach bypasses the issue of data silos and ensures that all critical information is considered.
One way to conduct automated reporting is offered by Microsoft 365 with its Power Platform. The Business Intelligence Software (BI software) “Power BI” available in Microsoft 365 is excellent for collecting, processing, and creating meaningful reports from data in different systems, such as ERP and DMS systems. The reports created and published there can then be made available directly to all users in SharePoint Online. This means that order entries, customer acquisitions, annual business planning, and more can be presented in SharePoint Online through Power BI.
Creating Reports Easily in Shareflex
The valuable data within Portal Systems’ Shareflex solutions can be easily utilized and transformed into reports using Power BI. From contract and document management to invoice processing, all solutions within the Shareflex ECM Online product suite are based on SharePoint Online and Microsoft 365. If you’d like to learn more about our solutions and reporting with Power BI in Microsoft 365, please don’t hesitate to reach out. We’re here to assist you in finding the right solutions to digitally support and advance your business.